Understanding Bid Risk with Monte Carlo
Every bid review comes back to the same worry: is the markup enough to cover what the job might actually cost? The Monte Carlo panel on the Analyze tab answers that as odds, and flags the cost lines carrying the most risk so you know which quotes to firm up first.
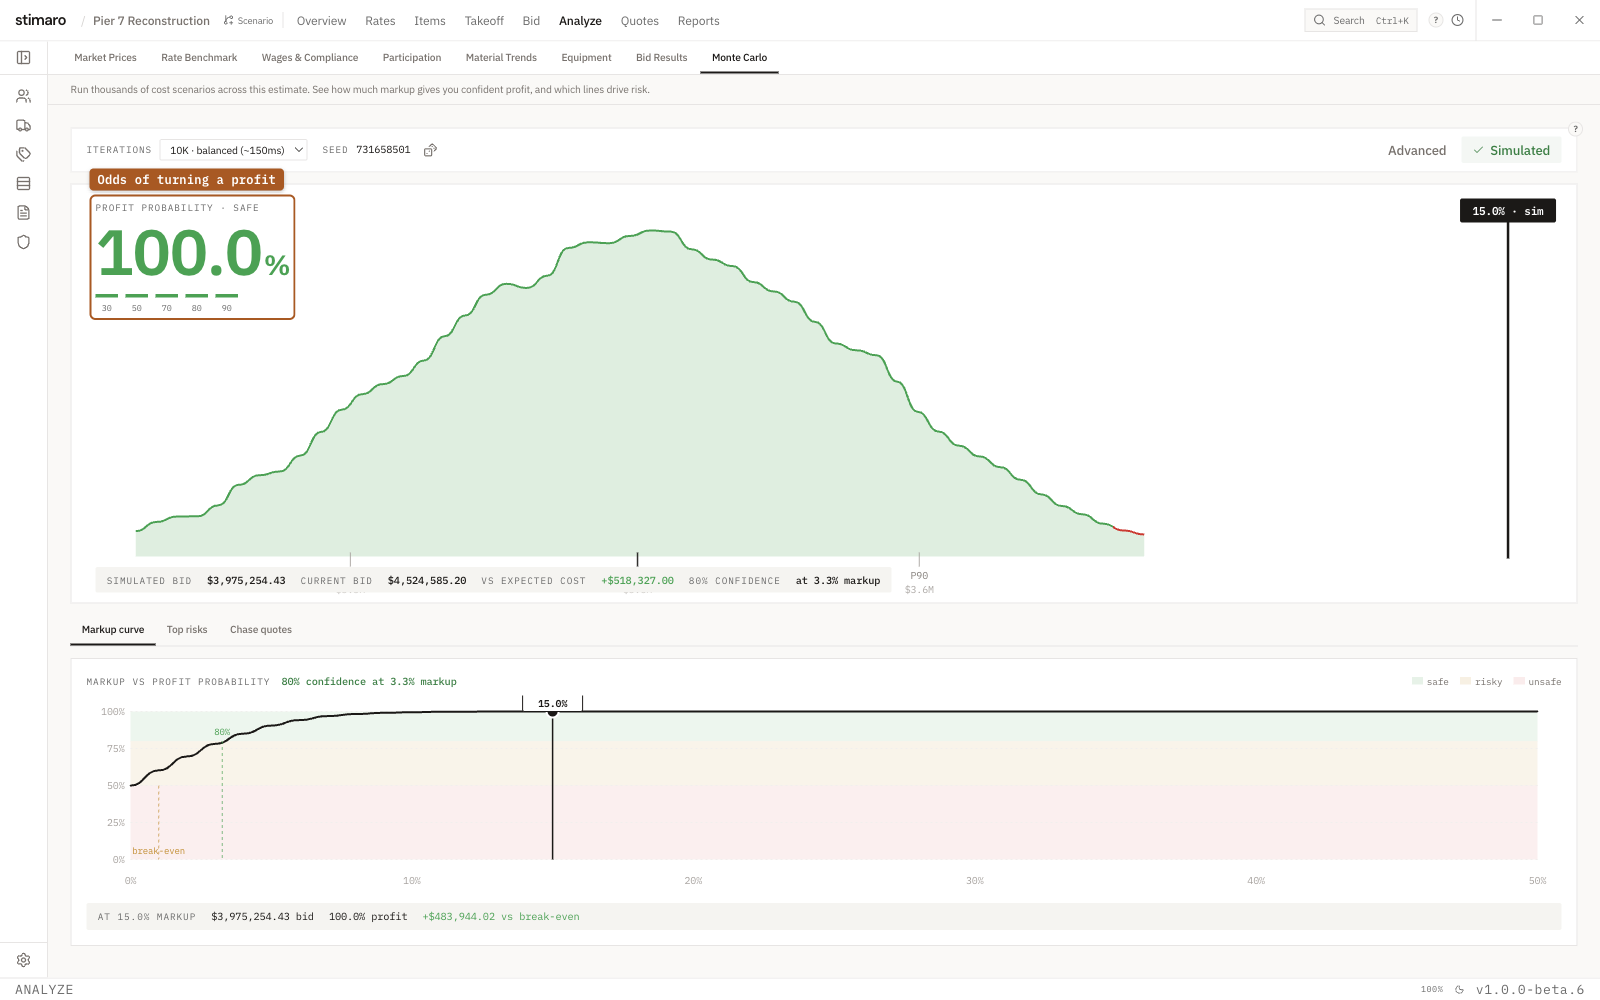
Monte Carlo panel. It runs thousands of cost scenarios and reports your profit probability, the markup for 80% confidence, and which lines drive the risk.What Monte Carlo does
A bid is one number, but the job it prices is a range of outcomes — quantities run over, a quoted material slips, a subcontractor comes in high. Monte Carlo runs thousands of cost scenarios across your whole estimate, letting each line vary within its uncertainty, and counts how often your bid still covers cost. The result answers the question every estimator carries into a bid review: is my markup enough? Instead of a gut feeling, you get an odds-based answer, plus a ranked list of the lines pushing the risk around.
Running a simulation
A few controls set up the run:
Iterations— how many scenarios to run, from a dropdown:1K · draft,10K · balanced(the default),50K · precise, and250K · exhaustive. More iterations give a steadier result at the cost of a longer run; the balanced setting is enough for most bids, with the precise and exhaustive settings for a final pass.Seed— the starting point for the random draws, with a reroll control. The same seed with the same inputs reproduces the same result, so you can rerun a number you're reviewing and get an identical outcome, or reroll to confirm a result isn't an artifact of one particular draw.Advanced— a toggle that opens per-line uncertainty overrides, for when you want to widen or tighten the assumed range on specific lines rather than accept the model's defaults.
Reading the profit-probability hero
The center of the panel is a distribution curve — the spread of simulated total costs — split into a green region and a red region at the bid line. Green is the share of scenarios where your bid covers cost; red is where it doesn't.
The large number is your Profit Probability: the percentage of scenarios in which the bid comes out ahead. It's labeled by how much cushion that gives you:
- Safe (green) — 80% or higher.
- Risky (amber) — 50% or higher, but under 80%.
- Unsafe (red) — below 50%, meaning more than half your scenarios lose money.
You can drag the bid line across the curve to set a simulated markup, anywhere from 0% to 50%, and watch the profit probability change live. Pushing the line right (more markup) moves scenarios from red to green and raises your odds; pulling it left does the opposite. This is the fastest way to feel the tradeoff between a competitive price and a safe one.
Around the hero, the panel reports the numbers behind the picture:
- Percentiles —
P10,P50(the median), andP90, marking where the cheap, middle, and expensive scenarios land. Simulated Bid— the bid implied by the markup you've dragged to.Current Bid— your actual bid, for comparison against the simulated one.- 80% Confidence at X% markup — the markup that gets you to 80% odds of profit. This is the single most useful readout: it tells you the price that makes the bid safe.
The tabs below the hero
Below the distribution are three tabs that go deeper than the headline number:
Markup curve— plots markup against profit probability across the full range, so you can see the whole tradeoff at once rather than one point at a time, and read off the odds at any markup you're considering.Top risks— ranks your cost lines by how much they contribute to the overall uncertainty. These are usually the estimated, un-quoted lines, and they're where your risk actually concentrates.Chase quotes— models what happens if you hard-quote selected lines, projecting how much the result improves once those lines are firm. It turns theTop riskslist into an action: it shows which quotes are worth chasing to tighten the bid the most.
Why this matters for the bid
Two questions decide most bids: is the markup enough, and where is the exposure? Monte Carlo answers the first as odds you can defend — an 82% chance of profit reads very differently from a 55% chance, even when the bid number is the same. It answers the second by ranking the lines driving the uncertainty, so the quotes you chase in your last hours before submitting are the ones that actually move your risk.