Reading the Overview Dashboard
Every project opens on the Overview tab — the first screen you see each working session and a fast read on how the estimate is doing. The KPI tiles sit up top; the panels below break down validation, risk, and cost.
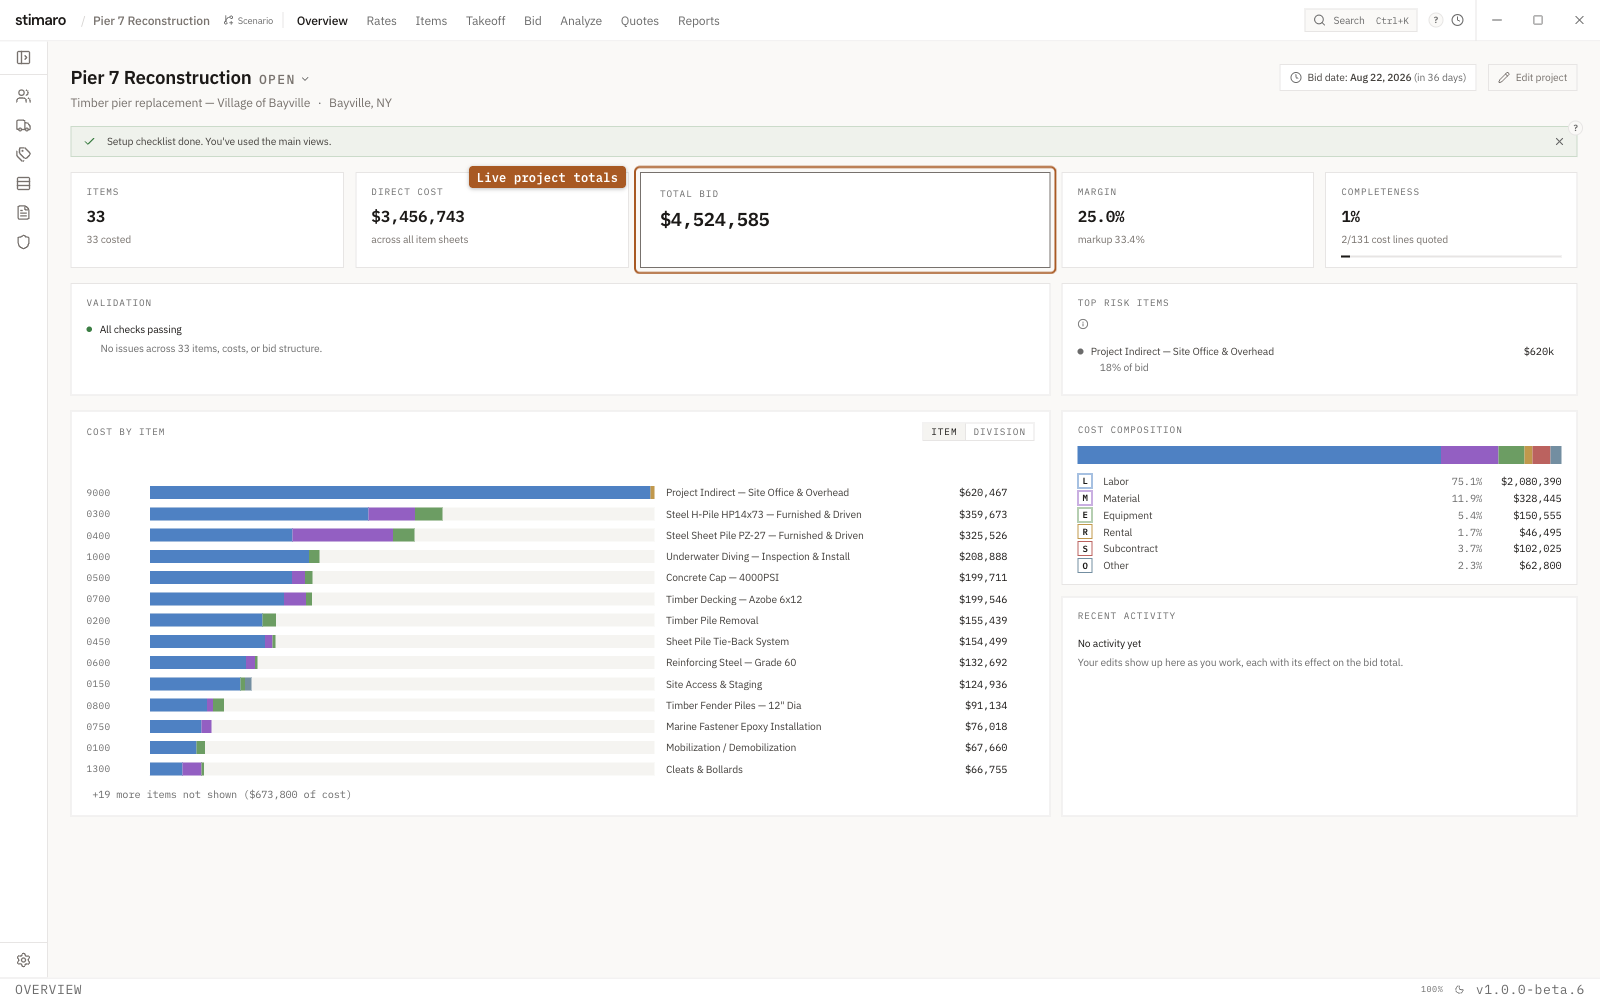
Overview tab. Live totals across the top, then validation, top risk items, and cost breakdowns — every tile is clickable straight to the underlying view.The KPI tiles
The tiles across the top are your project's headline numbers. Each one is clickable and jumps you to the view behind it, so you can go straight from a number that looks off to the place where you fix it.
| Tile | What it shows |
|---|---|
Items | The number of items in the project, with how many are costed underneath ("N costed"). A gap between the two tells you how much building you still have left. |
Direct cost | The sum of all your item sheets. This is a different basis from the direct cost shown on the bid sheet, so the two figures can differ — this tile totals every item sheet, whether or not it's linked into the active bid. |
Total bid | Your actual bid, with a delta showing where it moved from and when ("was $X · Nh ago") against the baseline, so you can see how the number has shifted as you've worked. |
Margin | Your margin as (bid − direct) ÷ bid, shown alongside the equivalent markup ("markup X%"). It turns red when negative — a fast warning that your bid is under your cost. |
Completeness | A readiness score for the estimate, with how much of the pricing is firm underneath it ("N/M cost lines quoted"). |
Needs attention
The Needs attention panel (also labeled Validation) surfaces up to seven open issues from your estimate, each with a severity dot and a location tag telling you where it lives. Click an issue to jump straight to the row it's flagging. When nothing is wrong, the panel reads "All checks passing" — the clean state you want to see before you submit.
Top risk items
The Top risk items panel calls out the items most worth a second look. An item lands here when one of three things is true:
- A line has no costs on it.
- A validation issue fires against it.
- One line exceeds 15% of the bid total — a single item big enough that an error in it would meaningfully move your bid.
Cost by item
The Cost by item panel shows horizontal stacked bars, with each bar's segments colored by cost category, so you can see both how cost is spread across the work and what makes up each piece. An item / division toggle switches between one bar per item and rolling the same costs up by CSI division, which is the faster way to see where the money is concentrated on a large estimate.
Cost composition
The Cost composition panel is a single stacked bar of your direct cost broken into the six cost categories (Labor, Equipment, Rental, Material, Subcontract, and Other), each segment labeled with its percentage and dollar amount. It tells you what kind of job this is at a glance — labor-heavy, material-heavy, or sub-driven.
Recent activity
The Recent activity panel lists your most recent changes, each with its signed effect on the bid total, so you can see not just what changed but which way and by how much it moved the number. Each entry links into History for the full record.
A brand-new project
Overview tab shows a setup checklist — the "Smart start" — that walks you through the startup steps. Once the project has content to report on, the checklist gives way to the dashboard described above.