A Tour of the Stimaro Interface
This article orients you to Stimaro's eight main tabs and the left sidebar, so you know where everything lives before you start your first estimate.
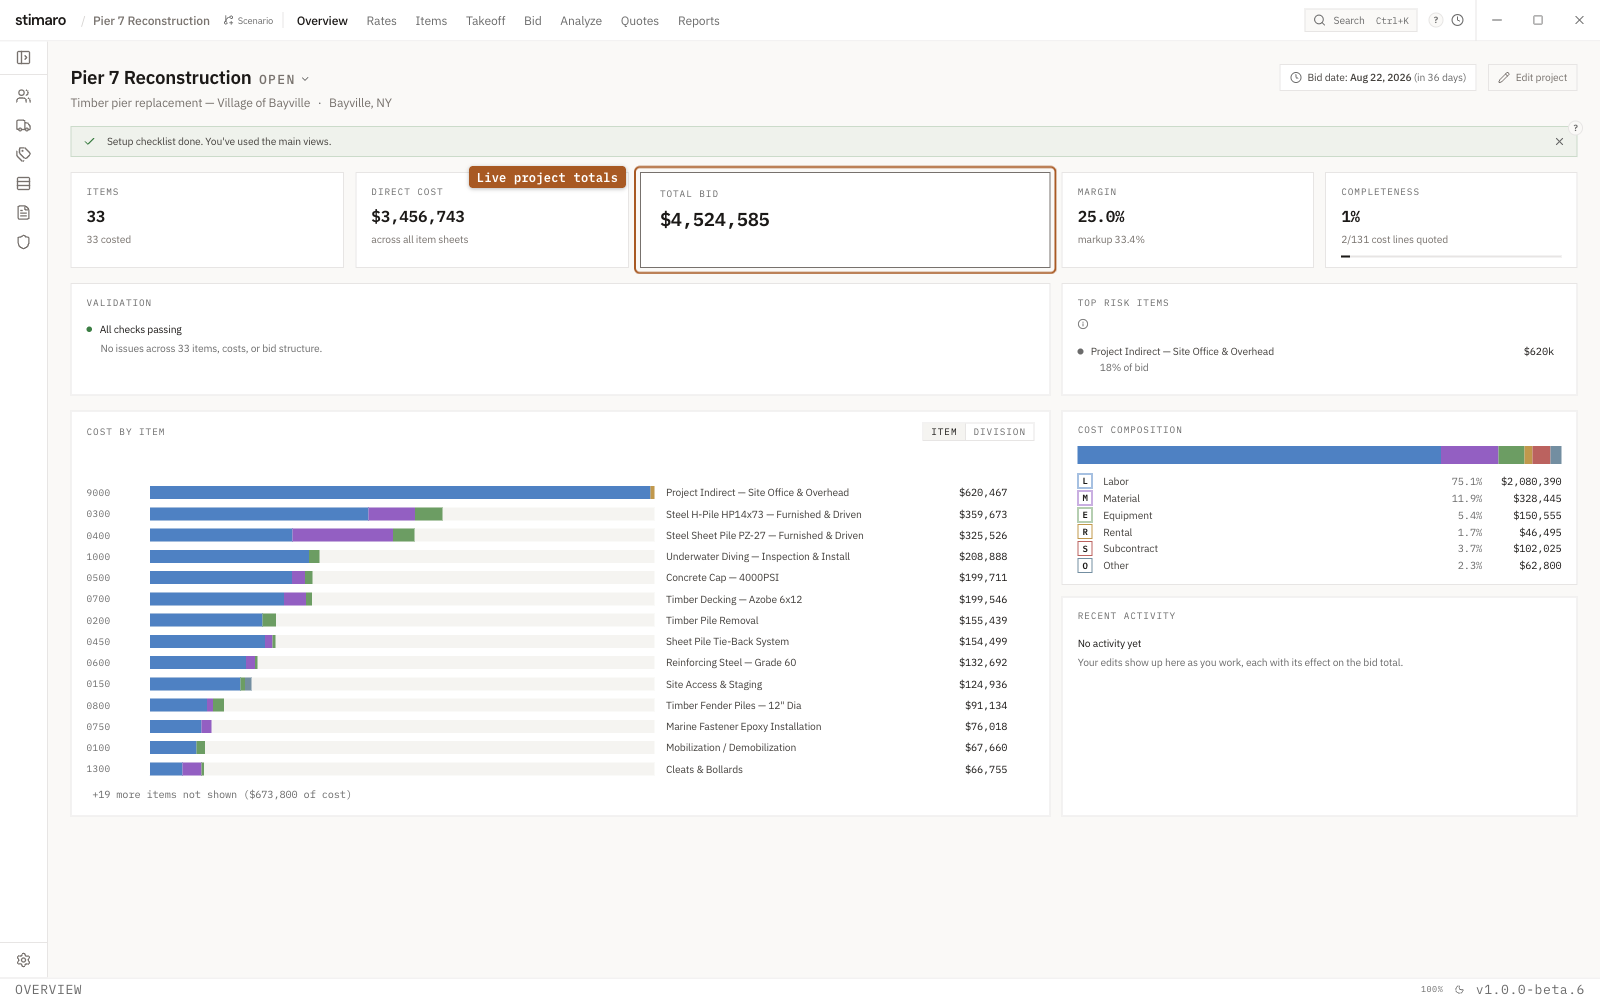
How to get around
The top bar runs across the top of the app whenever a project is open. Click any tab to switch views. Every tab also has a keyboard shortcut — press Ctrl+1 through Ctrl+8 to jump straight to each one, in the order below. You can also press Ctrl+K to open the Command Palette and type the name of any tab, item, rate, or bid row to navigate there instantly.
The authoritative shortcut list is always in Settings → Keyboard Shortcuts.
The eight tabs
1. Overview (Ctrl+1) — Your project's at-a-glance health check. Overview shows key metrics (total bid, direct cost, quote coverage, days to bid), a panel flagging any errors and warnings from the bid sheet, your top-risk items, a cost-by-item chart, and a recent-activity feed. When you first create a project, a setup checklist here walks you through the startup steps in order. Use Overview at the start of every session to spot anything that needs attention.
2. Rates (Ctrl+2) — Where you build and maintain all your cost rates, organized into sub-tabs: Labor, Equipment, Rental, Material, Subcontract, Other, Crews, Factors, and Fuel. Labor rates include base wage plus burden (the added cost on top of wages — payroll taxes, insurance, and the like). Equipment rates build a daily total from ownership cost, fuel, repairs, and insurance. Set your rates up here before building item sheets, since your estimates pull from them.
3. Items (Ctrl+3) — Where you build each item's detailed cost. The left panel lists all items in the project; selecting one opens its detail grid showing every resource (labor, equipment, material, and so on) with quantity, factor, rate, and total. Add resources with the Add Resource action. Work here after your rates are set up and before finalizing the bid.
4. Takeoff (Ctrl+4) — Where you import plan PDFs and mark up quantities directly on the drawings. Import plan sheets, calibrate the scale from a known distance, and place count, line, and area marks. Marks link back to item sheets, bid rows, and RFQ lines, so measured quantities flow straight into the estimate. Takeoff can run in its own detached window so you can view plans alongside your estimate.
5. Bid (Ctrl+5) — The bid sheet, where all your item sheets roll up into a priced proposal. Each row shows the item number, description, bid quantity, unit of measure, unit cost, bid unit price, and total. You apply markup here using the Markup Summary panel (category markup, overhead, and profit), preview scenarios with the Simulator, and access bid tools like the Bond Table and Overhead Checklist. Run Validate before you submit. You'll spend most of your final pricing and review time here.
6. Analyze (Ctrl+6) — Market intelligence and risk analysis for your estimate. Analyze includes:
- Market Prices — public DOT bid-tabulation unit prices, to check your rates against what the market actually paid
- Rate Benchmark — compare your labor and equipment rates against DOT and prevailing-wage references by state and county
- Wages & Compliance — verify your labor rates clear federal Davis-Bacon prevailing-wage minimums
- Material Trends — Producer Price Index trends for steel, structural steel, concrete, and lumber
- Equipment — FEMA equipment benchmark rates for owned-equipment cost recovery
- Monte Carlo — run thousands of cost scenarios to see profit probability at different markup levels and find which lines drive the most risk
Use Analyze to sanity-check your rates mid-estimate or run a final risk pass before submitting.
7. RFQ (Ctrl+7) — Request-for-quote management: generate vendor RFQs, collect quotes, and compare side by side.
- Dashboard — lists all RFQs with vendor, send date, due date, and status.
New RFQopens a step-by-step wizard to pick a vendor and choose items to quote. - Compare — a grid of RFQ items across vendor columns, with the lowest prices highlighted. Lock the winning prices, then apply them back into your item sheets.
- History — a searchable archive of locked quotes across all projects, useful for price reference on repeat work.
Use RFQ once your item sheets are drafted and you know what needs external pricing.
8. Reports (Ctrl+8) — Where you produce client-ready PDFs and exports. A document rail lists built-in templates for proposals, bid forms, cost summaries, compliance certifications, and more, plus any you've authored. Select a template for a live preview, use the inspector to toggle sections and apply your Brand Kit (logo, colors, fonts), and export. The Package Builder combines multiple templates into one paginated PDF. Use Reports at the end of the process to prepare submittal and review packages.
The left sidebar
The sidebar runs along the left edge while a project is open. Click the arrow at the top to expand or collapse it.
Libraries gives you project-wide reference lists: Customers (client names and codes), Vendors (used in rate tables and the RFQ wizard), Cost Codes (accounting codes for cost tracking), Sections (header labels for the bid sheet), and Templates (saved item-sheet templates for reuse across projects).
Project Tools contains the Bond Table, which opens the tiered bond-premium editor.
Settings, pinned at the bottom, holds display preferences, keyboard shortcuts, data management, and your account.